Have a look at this:
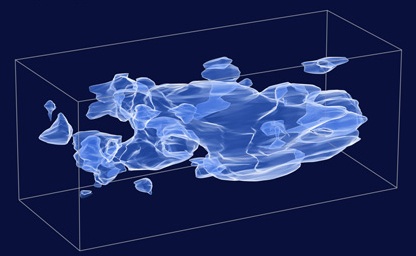
What is it? It is an image of part of the three dimensional (see below) distribution of clumps of dark matter in our universe, produced by an extensive survey using the Hubble telescope. How did they produce it, given that dark matter is -by definition- not visible? They deduced the presence of the chunks of dark matter by looking at the gravitational lensing it produces on visible matter. Gravity bends light, recall, and so if you have some light coming from an object, such as a star, or a whole galaxy (typically), when it passes by something massive (such as a clump of dark matter) its path will get bent on its way to you. This is of the same thing that a lens (such as perhaps in your glasses or contact lenses, and of course in your eye) does to light coming from objects you’re looking at. The way the light from an object is bent results in a pattern in the final image that tells you a lot about the object that bent the light – its mass, location, and shape.
 There’s a picture of a lensing example to the right, the lens in that case being a visible dense cluster of galaxies. The smeared-out streaks are secondary images of the galaxies that are behind the cluster. The gravity from the concentrated mass of the cluster bent the light from them, you see. More on that example here. A clump of matter that is massive and concentrated – as the cluster is in the example – but made of dark matter (so not visible) will do a similar thing to the light from distant galaxies, and so leaves evidence of itself despite being invisible. Most dark matter clumps are not going to be as dramatic lenses as the above, but the idea is the same. With enough experience with lens images, even more slight effects (that just show up as slight distortions in the shapes of visible galaxies) can give clues to the presence of invisible mass – dark matter.
 Now imagine If you have enough dark matter lensing examples to observe (perhaps from a big survey of the sky with a powerful telescope like Hubble!), you can put together a map of the dark matter’s distribution! This is what the scientists behind the new research did! When you look up at the sky, you see a two dimensional image. The depth (a third dimension) achieved by looking at further away objects on the galactic (and beyond) scales we’re talking about involves looking at light that was emitted much earlier. So the three dimensionality in the image at the top should really be thought of as having time running along the longest dimension. You’re seeing the evolution of the dark matter. It is growing clumpier toward the left, under the influence of gravity. Toward the right is earlier, reaching back in time more than 6.5 billion years – almost half the age of the universe. You can read the full story on NASA’s site here, and a story on the BBC here.
Dark matter, which makes up about 83% of all the matter in the universe, is crucial to our understanding of the life and evolution of the universe. The clumping together that we observe for visible matter -galaxies, stars, us- is believed to be connected to the clumping of the dark matter and this survey confirms that, more or less. Here is a picture of visible and dark matter distributions, side by side, showing similar clustering:

From the NASA site:
This is consistent with conventional theories of how structure formed in our evolving universe, which has transitioned from a smooth distribution of matter at the time of the Big Bang.
The researchers used data from Hubble Space Telescope’s largest survey to date of the universe, the Cosmic Evolution Survey (“COSMOSâ€). The COSMOS field covers a sufficiently wide area of sky – eight times the area of the full Moon – for the large-scale filamentary structure of dark matter to be clearly evident. To add 3-D distance information, the Hubble observations were combined with data from Europe’s Very Large Telescope in Chile, Japan’s Subaru Telescope in Hawaii, the U.S.’s Very Large Array radio telescope in New Mexico, as well as the European Space Agency’s orbiting XMM-Newton X-ray Observatory.
The dark matter map was constructed by measuring the shapes of half a million faraway galaxies.
More information about the clumping gives us more information about the formation of structure in the universe – a large part of the the story of how we came to be. There’s a lot of exciting work to do using this new window on our universe. Some of the work will involve refining this work quite a bit – there are some puzzling features (i.e., some “naked” dark matter clumps -ones that are not associated to clumps of visible matter) that may be anomalies in the data analysis, or new and interesting physics. Time and further work will tell.
-cvj

Pingback: Cool picture of dark matter | Mr. Weiss' blog
i like the idea of multiple dimensions having an effect of what we are seeing. perhaps it could also have something to do with time. like light would speed up through an area where time is faster and it would travel slower through an area where time is slower, possibly bending the light and throwing off these calculations that always assume that time is a constant throughout the universe. time is not a constant, and i do believe that is part of what is missing in some of these calculations.
Pingback: yet anotherblog | ΧάÏτες ΙΙ
Pingback: Dark Puzzles - Asymptotia
Pingback: Through a Lens Darkly - Asymptotia
Pingback: gr.yet.anotherblog.net » Blog Archive » ΧάÏτες ΙΙ
Hi Doug,
I’d categorize as ‘more mathematically inclined’ but not a ‘mathematical masochist’, so I’ll go for the middle way. Thanks so much,
B.
B – mathematically that additive value (which is the mass-sheet degeneracy refered to in the cosmic variance thread) can be almost anything, so if you allow for such a thing as negative density, then yes you can have it surrounding the positive peaks and have lower total mass.
Usually when I hear negative density used, people really mean below the cosmic mean density not an absolute density that is less than 0 (which means negative mass particles).
The mass-sheet degeneracy is a huge problem when we look at clusters of galaxies, as even with a 30′ field of view camera you’re not getting far enough away from the cluster to get back to a cosmic mean, so the mass-sheet degeneracy is one of the larger sources of errors for measuring cluster masses. For a large random field like COSMOS, this should be less of an issue since the average should be close to the cosmic mean (whether we know what that value is or not is another question).
For additional reading on weak lensing, there was a ARAA article written by Yannick Mellier in 1999 which has the basics in a fairly user friendly way (astro-ph/9812172). For the more mathematically inclined you can work through Peter Schneider’s 100 page discussion in one of the volumes of the Saas-Fee lectures (astro-ph/0509252, or you can probably buy the book online). For the mathematical masochists, I would suggest the 200 page behemoth by Bartelmann and Schneider in Physics reports (astro-ph/9912508).
Hi Doug,
Thanks, this is really helpful! It’s not too technical – in fact, if you have a reference about the data reconstruction and subtraction of the mean value I’d like to have it more technical (like, I’m not afraid of equations, except when I have to use them on a blog 😉 ) Do I interpret your answer correctly with saying, if we don’t assume the mean value is the cosmic mean, it could in principle be that we have a void surrounded by negative density? Best,
B.
Diagram of the Lagrange Point gravitational forces associated with the Sun-Earth system.
Might it give dark Matter a “Lagrangian view” in cosmology/WMAP, considering such gravitational relationships?
Similar computerize views have been developed in supernova’s. QGP plasma.
Clifford thanks.
I guess what we can be thankful for in the 3-D model presented, is it confirms the fact that Dark Matter does not reflect or emit light, surely if this was not so, then the whole of visible Cosmology would never get off the ground. Our Light leaving our Galaxy would pollute and inhibit our ability to observe Galaxies at far away distance’s.
The night sky is truley dark, for a specific reason, I have heard of this argument that was formulated in the early 20th century, but cannot remember who brought it to the foreground, thanks again.
Start early and run time forward instead…. The distribution starts out more smooth, since structure formation is driven by gravitational attraction… There are small seeds of inhomogeneities in the fluid that get amplified by gravity over time. You don’t need to worry about the acceleration and expansion of the universe for this process to make sense. I hope I answered the right question….
Cheers,
-cvj
Although Doug has answered an interesting question, if I may proceed to ask:If Dark Matter has any influence on visable matter, going back to the early distribution set out in the 3-D image, why is the distribution smooth the further one goes back in Time?
Is there any correlation to the fact that the further one goes back in Time, the less acceleration is imposed upon ordinary visable matter?..and would not this co-incide with the fact that the Universe’s matter (locally) is experiencing a vast increase in its acceleration/expansion?
I suppose what I am inquiring about is, is the expansion responsible for what appears to be an extraction process?..ie visible matter being “extracted” out of a smooth highly strong gravitational energy?
Pingback: Andrew Jaffe: Leaves on the Line
Thanks Doug!
-cvj
In answer to Bee’s question (and perhaps a bit too technical) –
Weak lensing doesn’t actually measure the mass, it measures the change in mass. This means you take the edge of your area you are reconstructing and set it to some fixed value, then integrate inward to build up a picture of the peaks and valleys of the mass distribution. You’re left over with a free constant, which is the mean value of the mass at the edges (or averaged across any other region you choose).
For a field as large a the one Massey et al reconstructed, the mean mass in the field should be very close to the cosmic mean, which we think we’ve measured reasonably well using WMAP, supernova surveys, etc. So you can get rid of that free parameter by assuming that the mean mass averaged over your field is that measured cosmic mean (it is an assumption though).
As usual, the press coverage in what is new and interesting about this result is slightly misleading. Larger areas than this one have been covered by weak lensing before (the largest survey was about 100 square degrees, which is about 400 full moons). People have also done 3-D reconstructions before (most weak lensing results project all of the mass onto a 2-D screen, the 3-D method requires you to be able to get a rough redshift for each of the background galaxies which then lets you get a third dimension, although with much larger errors in that third dimension than in the 2 on the sky). This is the first time, however, that someone has done both. It’s also the largest field reconstructed from HST imaging (which can get a better signal-to-noise reconstruction than ground based because you can measure shapes for more galaxies with the smaller point spread function).
In answer to Charles T’s question –
unless they did something truely novel (and a quick read of the Nature article didn’t indicate so), then the transformation of the shear (shapes of the galaxies) into the mass distribution assumed that gravity was Newtonian.
Hi Clifford,
yeah, that would be nice. The thing is that someone told me they actually subtract some background value to normalize the minimum value to zero, but I couldn’t find any reference on that. Have a nice day,
B.
AH! Bummer! Again! A-L-W-A-Y-S I forget that html doesn’t like smaller as!
Okay, here is the rest:
Also, a void in a non-zero density ( [tex]\delta \rho[/tex] Dark Matter less than zero) acts as a diffraction lens, no? Do you know if anything like this is observed? Best,
B.
PS: Sorry, some self-ad – see also my post about Dark Matter
Bee, great question. I have no expertise in their analysis, so I cannot answer it, unfortunately. I hope others might speak up on this point….
Cheers,
-cvj
Hi Clifford,
this is a very interesting post! It really is amazing what can be extracted from such tiny distortions. I have a question about the analysis though that might sound a bit weird, but it’s been puzzling me. How do they set a ‘zero’ to the distortions? I mean, they can find out [tex] \delta \rho[/tex], but how do they set [tex] \rho = 0[/tex]? Do they just define the minimum of [tex]\rho [/tex]to be zero? I’ll give you an analogy: take a plane slice of glass. It doesn’t cause any lensing, but the density isn’t zero. How do they get rid of this normalization? Also, a void in a non-zero density ([tex]\delta \rho[/tex] Dark Matter
I’m not aware of any such theories or scenarios (extra dimensional or otherwise) that have been well-developed enough to give an alternative explanation for such weak lensing, and hence the whole map. This is entirely about four dimensional gravitational effects. MOND-type theories were dealt a sizeable bodyblow by the Bullet Cluster result (see end of my post for links) and of course….. the huge amount of data from other sources such as WMAP, in combination with all the other things we’ve established about cosmology that seem to need Dark matter of this sort. See also my post on CV a while back about the computer simulation work. It is entitled “Constructing Your Own Universe”.
Basically, you use a computer to runa a simulation of the evolution of the universe, putting in dark matter of various sorts. The type of dark matter that these new observations are suggesting is really there fits very well with the simulation results. The simulations already do a good job of showing that you get the right structures we observe to day for the visible matter (see image links etc from that post), as a result of evolving the universe with cold dark matter:
…and this is fitting reasonably well with the dark matter late-time distributions too (although not on the scales and resolutions of the above image…. I don’t think that the weak lensing can give you that level of detail).
See also a remark on that post by Risa Wechsler, who is an expert on that topic (simulations). She also points to her own lectures and other sources.
-cvj
Very interesting – for the last 400 years we only mapped the sky using electromagnetism. Is this the first time we have mapped the sky using gravity (if only indirectly)?
A layman’s question: Do the data unambiguously point to dark matter causing the distortion rather than something rather more fanciful – gravitational influence leaking though bulk dimensions from another brane (or another part of ours) for example.
Pingback: COSMOS Reveals the Cosmos | Cosmic Variance
Very kuhl, much like CAT scans and MRI’s of the universe. Of course, sometime down the road, some cult or another is going to find images of their deities in these graphic representations (Vishnu and his nine avatars for a start–all that blue).
Wow. That is awesome! In the past year, I think the science discoveries that impressed me most are this and the Bullet Cluster. In a few years when I finish undergrad and try to think of what to do, I heavily suspect I’ll be turning back to this.
That is SO COOL! Weak lensing is an amazing technique; I have no idea how they manage to pull so much information out of such tiny distortions. I’m very personally excited about this, because my job as a clueless undergrad slob involves comparing the distribution of galaxy clusters with the theoretical distribution of dark matter, and it would be super-fun to have an actual dark matter distribution to work with!
Of course, the phrase “work with” implies that my software works. Which it currently doesn’t… 😛